AROMEThe selected variable and region is available, but not for 2024-06-08, 12:00. You will switch back to the first available time step. AROME is a high resolution (2.5 km) weather forecast model which is used by various weather services in Europe. On the WZ, forecasts from Meteo France and the Norwegian Weather Service are shown for western Europe and northern Europe, respectively.
HARMONIE (DMI)The selected variable and region is available, but not for 2024-06-08, 12:00. You will switch back to the first available time step. DMI uses and codevelops the weather model HARMONIE. The output at WZ covers Northwestern Europe. The model (cycle 43 ) uses a grid resolution of 2.5 km with boundary conditions from ECMWF.
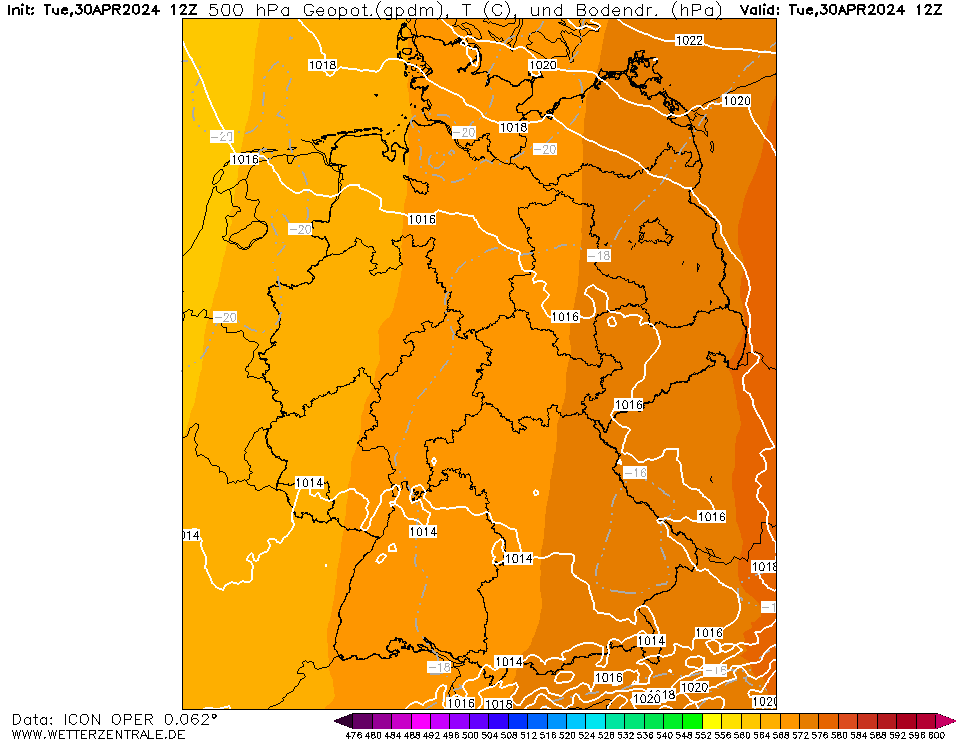
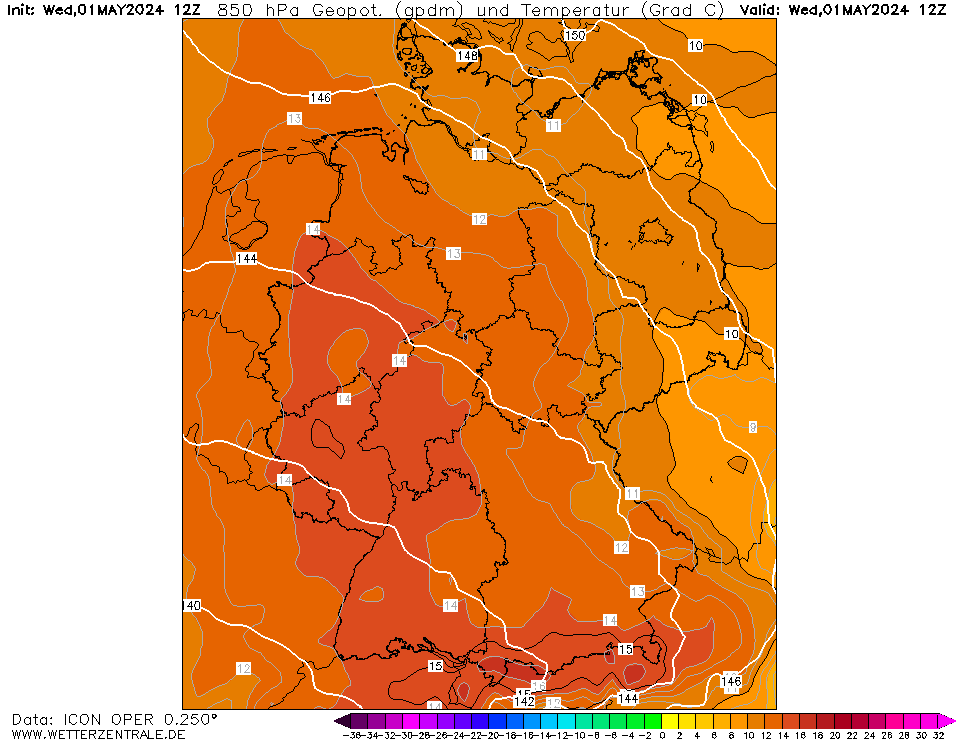
ICONCurrently selected. ICON is the global weather forecast of the German weather service (DWD) with a grid spacing of approx. 13 km globally (Europe nest: 6 km). Model output is available up to 180 hours ahead for the 0Z and 12Z runs, and up to 120 hours for the 6Z and 18Z runs.
WRFThe selected time, variable and region is available for this model. WRF (Weather Research and Forecasting model) is a freely available weather forecast model. WRF version 3.9 is run on the WZ servers and offers 4 forecasts per day up to 72 hours. It is currently run with a horizontal grid spacing of 5 km and uses the WRF single-moment 3 class microphysics scheme, the YSU PBL scheme and the Dudhia radiation scheme.


Member:
OP 0Sat 8 Jun 12:00
6Sat 8 Jun 18:00
12Sun 9 Jun 00:00
18Sun 9 Jun 06:00
24Sun 9 Jun 12:00
30Sun 9 Jun 18:00
36Mon 10 Jun 00:00
42Mon 10 Jun 06:00
48Mon 10 Jun 12:00
54Mon 10 Jun 18:00
60Tue 11 Jun 00:00
66Tue 11 Jun 06:00
72Tue 11 Jun 12:00
78Tue 11 Jun 18:00
84Wed 12 Jun 00:00
90Wed 12 Jun 06:00
96Wed 12 Jun 12:00
102Wed 12 Jun 18:00
108Thu 13 Jun 00:00
114Thu 13 Jun 06:00
120Thu 13 Jun 12:00
126Thu 13 Jun 18:00
132Fri 14 Jun 00:00
138Fri 14 Jun 06:00
144Fri 14 Jun 12:00
150Fri 14 Jun 18:00
156Sat 15 Jun 00:00
162Sat 15 Jun 06:00
168Sat 15 Jun 12:00
174Sat 15 Jun 18:00
180Sun 16 Jun 00:00

help
Download GIF
hover
Single-variable mode
You are now in the multi variable mode. Select all the variables of interest and they will be plotted side-by-side in a grid.
You are now in the multi variable mode. Select all the variables of interest and they will be plotted side-by-side in a grid.
URL of this map